My feed
Premium

Please
or
to access all these features

Chat with other users about all things related to working life on our Work forum.

Work

Any risk experts? Plotting risk appetite in relation to residual risk

18 replies

UseHerName · 15/01/2021 22:12

Bit niche this one and possibly dull

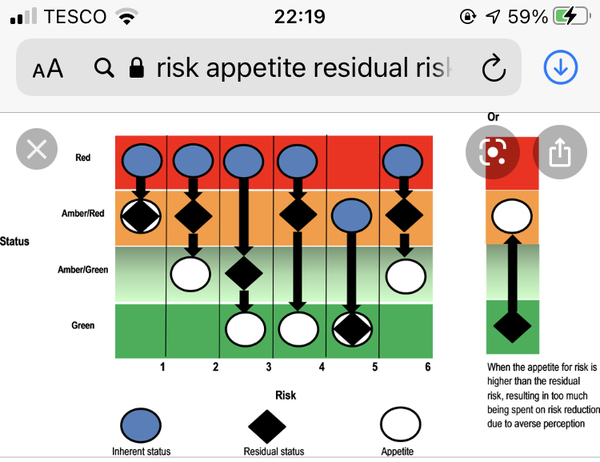
I’m trying to do a grid or something that plots residual risk scores against the corporate risk appetite and I just can’t quite get it.

I’ve scored the risk appetite levels as the inverse of the risk level score and I have the residual scores but I just can’t join it all up and I don’t have anyone to bounce this off 😩

I’m trying to show to the board where residual risks are outside of the risk appetite.

Can anyone help me?

OP posts:
Report
UseHerName · 15/01/2021 22:21

I think I need something like this.

All done in spreadsheets, no risk management system

Any risk experts? Plotting risk appetite in relation to residual risk
OP posts:
Report
Icenii · 15/01/2021 22:21

Are your residual risks made up of something like likelihood and impact you can plot on X and Y axis as the score, and then highlight those in red outside the corporate risk score?

Report
UseHerName · 15/01/2021 22:35

Yes it’s your typical impact/likelihood. The bit i think is missing is defining what the risk score ranges are for the risk appetite and then plotting the residual risk against that.

Im thinking

Hungry 13-16
Open 8-12
Cautious 4-7
Averse 1-3

Or am I overthinking?

OP posts:
Report
Icenii · 15/01/2021 22:37

Haven't they been defined by the board etc?

Report
UseHerName · 16/01/2021 11:06

You’d think wouldn’t you!! No they haven’t (don’t get me started), I’ll write them and theyll approve them!

OP posts:
Report
UseHerName · 17/01/2021 21:57

Thanks for responding though @Icenii

Anyone else any thoughts?

OP posts:
Report
NothingInterestingToDeclare · 17/01/2021 22:11

Surely you can only calculate residual risk for now using the applicable risk scoring mechanism, then obtain risk appetite from corporate by presenting the residual risk obtained from the risk process and only then re-present the final metrics showing any anomalies to be further worked out to mis matches between risk appetite and residual risk? I would be careful of defining everything as a default inverse there is accountability to take into account for acceptance of residual risk and it could amount to garbage in garbage out (if you will excuse the harshness of the phrasing)

Report
UseHerName · 18/01/2021 06:48

Yeah the board aren’t going to work out any risk appetite thresholds on their own (probably a risk in itself). I’ll have to present it to them as a done deal.

OP posts:
Report
UseHerName · 18/01/2021 06:55

It might be that I just put the typical line on the 4x4 matrix and have done with it, rather than over complicating it. That’s what we do now, I was just trying to improve it a bit

OP posts:
Report
Gliblet · 18/01/2021 07:01

Could you start by asking them for a statement rather than defining risk by risk (i.e. we have a high appetite for strategic risk but a low appetite for reputational risk) depending on what the organisation's general priorities are?

Do they actually understand what the different risk types are and what they might mean for the organisation? I had to write a full 'how to' with a glossary before our leadership team felt confident in taking a grip on our RR.

Report
omygoditsearly · 18/01/2021 07:04

Well starting off at likelihood and serverity is fine and so is the arbitrary soundings that you have applied. The next tuning is to convert back to the estimated cost in the severity column and decide on the financial reserve required. For example if severe is £1-10m then a rating of likely is £5m but a rating of extremely unlikely may be £5000. This can then give a guide as the financial "value" of a carried risk in your boundings above. Important to note that most organisations like to reference both reputational damage and cores values when grading. I caveat all of the above with the fact that I'm not a risk expert but often contribute to risk analysis.

Report
Nacreous · 18/01/2021 07:11

I think the key thing here is to offer the board a set of choices about risk appetite - so not one answer but a couple of options that they can pick from? You need some sort of direction about what areas they are happier with risks for otherwise it's hopeless.

One of the ways our organisation does it is that all "Board" risks have a specific risk appetite number attached to it by the risk owner. The board risks come to board for review and then if they don't think it's right they comment on it. Anything that's not a board risk is held by its own owner and they have control over the risk appetite (on the basis that they know the risk appetite of their own section of the organisation).

The audit committee is then in charge of making sure the board is taking appropriate measures to manage and understand their own risk. So they might look it there is consistency in risk appetites etc?

Report
UseHerName · 18/01/2021 08:06

Thanks @Gliblet and @omygoditsearly ive done both of these exercises and they’ve been approved by the board. It’s just now how to show when the residual risk is outside of the risk appetite 🤔

OP posts:
Report
Nacreous · 18/01/2021 08:11

Can you not just do that numerically?

E.g. 55 grid one is likelihood the other severity.

3/5 on likelihood scale (likely in ours), 4/5 on severity (severe) gives 12. Risk appetite is 3
3 = 9, 12> 9 therefore too high?

Report
Gliblet · 18/01/2021 08:13

If they've given you a general 'we're more or less fine with this kind of risk, not so much this kind why not use your suggested scores to come up with a heat map? This should give the visual thinkers among them something that gives an at a glance idea of how many of their risks are sitting in each 'band' and where they're being overcautious or cavalier.

Report
UseHerName · 18/01/2021 08:41

That’s what I’m trying to come up with but I’m really struggling 🙈

OP posts:
Report
NothingInterestingToDeclare · 18/01/2021 08:46

Only other comment on the mechanism as someone else has mentioned would be could the board assign an appetite rating per risk type - so if you can come up with a sensible set of risk types applicable to your organisation then assign each risk a type and you at least have a dialogue there (with my audit hat on I think not basing risk appetite on something fed back from the board is possible weak practice rather than non conformance but either way is likely to be ineffective if the board haven’t bought in to it and don’t really get it).

From a display perspective would agree with above that a heat map would show your data in a way the board can interpret easily. Good luck with it - and have enjoyed a thread about risk Grin

Report
UseHerName · 18/01/2021 08:48

Yes @NothingInterestingToDeclare slightly random topic for mumsnet!

OP posts:
Report
Please create an account

To comment on this thread you need to create a Mumsnet account.