My feed
Premium

Please
or
to access all these features

MNHQ have commented on this thread

AIBU?

It’s scandalous that you can’t see how many covid cases in your city

34 replies

Redolent · 30/06/2020 18:03

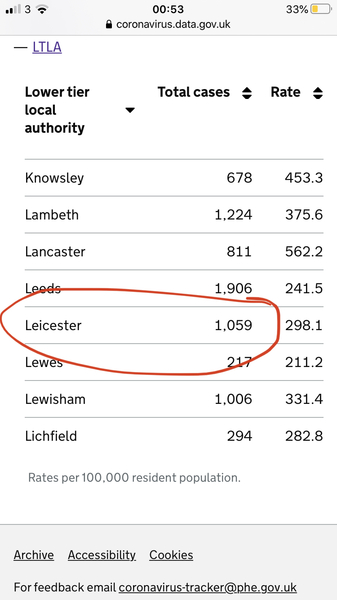
Oh, but you can - you just have to put in your postcode into one of those online search tools right?

Wrong.

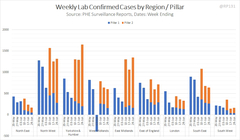
Those only show Pillar 1 data. ‘Pillar 1’ is swab testing in hospitals. ‘Pillar 2’ is testing among the wider population. It’s where 75% of cases are.

The overall figure for new cases published each day is accurate. But it’s almost impossible to find out where they are at a local and regional level.

So using one of those tools, you could have been assured that your city hasn’t seen any new cases for weeks, when that’s patently false.

Nationally, your chance of getting coronavirus might be 1:1250. But locally, it could be 1:250, and you would have no way of knowing. Or modifying your behaviour accordingly.

In the FT today:

www.ft.com/content/301c847c-a317-4950-a75b-8e66933d423a

OP posts:
Report

Am I being unreasonable?

49 votes. Final results.

POLL
You are being unreasonable
14%
You are NOT being unreasonable
86%
greenlynx · 01/07/2020 00:35

I’ve just realised this (was mentioned in the local newspaper) and I’m fuming! I was under illusion that it’s all fine locally and now it actually isn’t!

I was wondering yesterday how did the outbreak at Leicester was missed for so long and now it’s obvious - because they didn’t have data daily so had no idea what’s going on.

Report
greenlynx · 01/07/2020 00:38

By the way can’t open the article - it’s only by subscription.

Report
SisterAgatha · 01/07/2020 00:40
Report
gotothecooler · 01/07/2020 00:43

But it’s almost impossible to find out where they are at a local and regional level.

I check this information every day on the Gov site

Report
SisterAgatha · 01/07/2020 00:45

The link I’ve posted shows lower local authority areas so I can even check our tiny little area in Herts. The media is the last place you should check statistics.

Report
ChavvySexPond · 01/07/2020 00:48

The blue is the data people in Leicester have access to. The red is the truth.

No wonder they were stunned to get hit with a lockdown.

It’s scandalous that you can’t see how many covid cases in your city
Report
Redolent · 01/07/2020 00:51

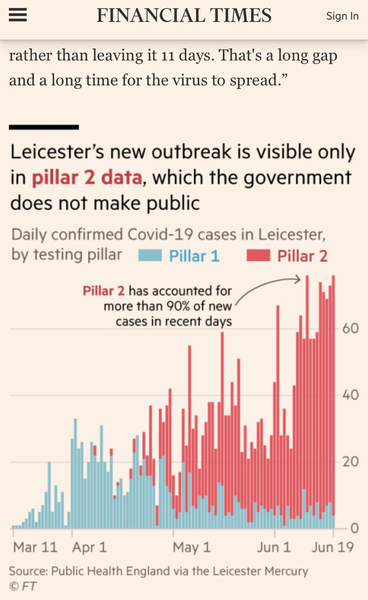
This reply has been deleted

Message deleted by MNHQ. Here's a link to our Talk Guidelines.

SisterAgatha · 01/07/2020 00:53

Why would they be stunned, people across the U.K. have had full access to the daily data on the gov website which is easily googl-able by anyone with a smart phone or laptop.

Report
SisterAgatha · 01/07/2020 00:54

It’s not only me that can see this, right?

It’s scandalous that you can’t see how many covid cases in your city
Report
PickAChew · 01/07/2020 00:57

Or it could have been 1 in 6000 but you wouldn't have known because of the influx of belated data.

No new cases reported in my entire county of over half a million in the past week. OK, there was 1 but another one was retracted as a duplicate report.

Report
Redolent · 01/07/2020 00:58

@SisterAgatha

It’s not only me that can see this, right?

Yes I can see it too, and like I said that information is wrong. It’s Pillar 1 only.

Leicester does NOT have a total of 1,059 cases.

—————-
From the BBC:


Leicester City Council said the latest figures obtained by the authority showed that 3,216 Covid-19 cases had been confirmed in the city since the start of the epidemic.

"Of these, 944 cases were reported in the last two weeks," a spokesman said.

"These figures include the number of patients and staff testing as positive in hospitals and positive cases identified in testing centres."
OP posts:
Report
PatriciaHolm · 01/07/2020 00:59

@sisteragatha @gotothecooler

That link is NOT all cases. That's the point.

That link, and all the regional data out there, is PIllar One only. Just the tests in hospitals/healthcare settings/health workers.

It does NOT include Pillar 2: community tests. Which now make up 75% or more of tests and positives. So the regional data is extremely misleading.

This is what the data looks like for pillar 1 and 2 for week end 21 (extrapolating from the PHE survelliance document, thanks to @rp131 on Twitter.) you can clearly see why they are worried about Leicester....

And what the difference is in terms of positives by pillar by region. Showing the big discrepancies.

It’s scandalous that you can’t see how many covid cases in your city
Report
greenlynx · 01/07/2020 01:00

@gotothecooler and @SisterAgatha
The government website breaks only Pillar 1 data by local authorities but not Pillar 2 (community cases).
I’ve realised this just yesterday myself. It’s actually written on BBC website where you are checking confirmed cases in your area. It says: Cases in England will be an under-count.

Report
ChavvySexPond · 01/07/2020 01:09

Why would they be stunned, people across the U.K. have had full access to the daily data on the gov website which is easily googl-able by anyone with a smart phone or laptop.

No we don't @SisterAgatha. That's the point.

Report
FlamedToACrisp · 01/07/2020 01:13

Is that figure the total right now, or the total since the pandemic began? I've been keeping a record and our area has just gone up and up, yet the govt chart shows it going down.

Report
confusedandtired99 · 01/07/2020 01:25

I’m furious. I’ve put it on my facebook wall, and anywhere else I can think of, but in the rush to get back to normal I don’t think many people will care.

In the East Midlands where I live the infection rate is now back to what it was in mid April apparently.

metro.co.uk/2020/06/30/hundreds-local-authorities-missing-vital-coronavirus-testing-data-12925072/

But I imagine lots of people won’t care and they will still all go out on the 4th regardless.

Report
NothingIsWrong · 01/07/2020 01:32

YABU. It is here by upper tier local authority from the weekly surveillance report.

assets.publishing.service.gov.uk/government/uploads/system/uploads/attachment_data/file/896777/Weekly_COVID19_report_data_current.xlsx

Figure 9 data is what you are after. This shows pillar 1 and pillar 2 totals by UTLA

Report
PatriciaHolm · 01/07/2020 01:37

That excel has only been available for the last few days though (it's where my graphs above are extrapolated from) and it's not the data that is being used by any of the regional search tools out there. It's buried in the notes from the PHE surveillance report. The vast majority of people would have no idea it exists (and it only has for a few days).

Report
NothingIsWrong · 01/07/2020 01:41

OK, that gives the rates per 100,000 for this week. Populations are on Wiki. So you can work out how many cases this week.

This appears to be the first week they have supplied the excel data, but going forward you will be able to see how many pillar 1 and pillar 2 per week by ULTA.

It would be better if it was LTLA, but hopefully that will be available soon.

Report
NothingIsWrong · 01/07/2020 01:42

Fingers crossed now it's known that it's out there the various search engines will include it.

Report
Redolent · 01/07/2020 01:45

@confusedandtired99

I’m furious. I’ve put it on my facebook wall, and anywhere else I can think of, but in the rush to get back to normal I don’t think many people will care.

In the East Midlands where I live the infection rate is now back to what it was in mid April apparently.

metro.co.uk/2020/06/30/hundreds-local-authorities-missing-vital-coronavirus-testing-data-12925072/

But I imagine lots of people won’t care and they will still all go out on the 4th regardless.

I can imagine it was done deliberately for that reason.

‘But you know, we don’t want to WORRY people’

nods of assent
OP posts:
Report
NothingIsWrong · 01/07/2020 01:46

They've obviously got the data going back as Fig 9 was first published for w/e 28th May so let's hope they release it

Report

Don’t want to miss threads like this?

Weekly

Sign up to our weekly round up and get all the best threads sent straight to your inbox!

Log in to update your newsletter preferences.

You've subscribed!

whereistherum · 01/07/2020 01:49

And yet another reason why they are no longer doing daily briefings, while I think they were being limited, the government are not longing answering questions unless they are allow someone to interview them.

Report
Redolent · 01/07/2020 01:49

@NothingIsWrong

They've obviously got the data going back as Fig 9 was first published for w/e 28th May so let's hope they release it

I think moving on we might see clearer data, yes. But as revealed by @SisterAgatha above, the vast majority of people have been making completely inaccurate risk assessments.
OP posts:
Report
MaintainTheMolehill · 01/07/2020 02:01

This is awful, people have been evaluating risk based on completely misleading data.

Is Scotland also not reporting pillar 2 data?

Report
Please create an account

To comment on this thread you need to create a Mumsnet account.